

Commercial Intelligence for Modern Buying Markets
Feinripp Studios applies Commercial Intelligence to structural growth in AI-driven markets. We engineer how markets perceive, trust, and choose your company before buying decisions begin. The Shift
Demand Moves Upstream.
Customers discover, compare, and pre-select solutions through AI systems, search environments, reputation signals, and market narratives long before traditional channels influence the sale. Most companies still optimise media spend, funnels, and conversion rates. Few optimise how they are interpreted before demand is created. That gap will define the next generation of market leaders.
 The Cost
What Happens When Preference Forms Elsewhere.
- Rising acquisition costs
- Lower close rates
- Increased price pressure
- Slower pipeline velocity
- Reduced pricing power
- Competitors capturing early demand
Markets rarely announce these shifts clearly. They appear later in margins, missed forecasts, slower growth, and lost momentum.
 What We Do
We turn perception into commercial advantage.
Feinripp Studios applies Commercial Intelligence to structural growth in AI-driven markets. We align brand, signal, and platform interpretation so you are seen, recommended. And chosen. F+ Index Scores
A Practical Operating Model For Structural Growth.
Margin-Based Media Trading
- Inventory Buying: High-Quality vs. Cheap Clicks
- Margin-Aware Bidding Algorithms
- Trust-Gap Asset Design (Creatives that convert)
- Investment Strategy: Protecting Market Share
Adaptive Omnichannel Orchestration
- Holistic Channel Management (Seamless Integration)
- SEO+GEO, Agentic Visibility (ASOV): Defensive Market Position & Entity Building
- Social & Content: Demand Generation & Narrative
- Retail Media & Geo: Connecting Online to Offline
- Contextual Presence: Being where the customer is
Profitability & Growth Planning
- Shift from ROAS to POAS
(Profit on Ad Spend) - Predictive MMM (Marketing Mix Modeling)
- Brand Authority Valuation (Lowering CAC)
F+ Commercial Growth Architecture Model
Contextual AI & Commercial IntelligenceMarket Foresight & Business Resilience
- Shift from ROAS to POAS (Profit on Ad Spend)
- Predictive MMM (Marketing Mix Modeling)
- Brand Authority Valuation (Lowering CAC)
Experience & Service Innovation
- Data-Driven Service Design (Developing new revenue streams)
- Trend-Based Product Evolution (Adapting to future demand)
- Return Rate Prevention (UX Psychology)
- Frictionless Sales Pipeline Design
F+ Commercial Growth Architecture Model
Contextual AI & Commercial IntelligenceMargin-Based Media Trading
- Inventory Buying: High-Quality vs. Cheap Clicks
- Margin-Aware Bidding Algorithms
- Trust-Gap Asset Design (Creatives that convert)
- Investment Strategy: Protecting Market Share
Profitability & Growth Planning
- Shift from ROAS to POAS
(Profit on Ad Spend) - Predictive MMM (Marketing Mix Modeling)
- Brand Authority Valuation (Lowering CAC)
Experience & Service Innovation
- Data-Driven Service Design (Developing new revenue streams)
- Trend-Based Product Evolution (Adapting to future demand)
- Return Rate Prevention (UX Psychology)
- Frictionless Sales Pipeline Design
Market Foresight & Business Resilience
- Shift from ROAS to POAS (Profit on Ad Spend)
- Predictive MMM (Marketing Mix Modeling)
- Brand Authority Valuation (Lowering CAC)
Adaptive Omnichannel Orchestration
- Holistic Channel Management (Seamless Integration)
- SEO+GEO, Agentic Visibility (ASOV): Defensive Market Position & Entity Building
- Social & Content: Demand Generation & Narrative
- Retail Media & Geo: Connecting Online to Offline
- Contextual Presence: Being where the customer is
 Measurement and Diagnose
The Toolbox
We measure and improve three drivers across human and AI decision systems:

Agentic Share of Voice (ASOV™)
How often your company is surfaced and preferred in critical buying moments

Brand Performance Score (BPS™)
How strongly demand forms without paid stimulation

Enterprise Profit on Ad Spend (E-POAS™)
How effectively growth investment converts into profitable revenue
What gets measured improves. What gets aligned compounds.
Sustainable EBITDA Growth & Market Innovation
 The Team
Experts In Intelligence, Strategy, And Growth.

Jochen Ihl
Chief Growth Strategist
& Co-CEO
(Growth Systems, Performance Economics)

Thomas Bausenwein
Chief Commercial Strategist
& Co-CEO
(Commercial Strategy, Client Mandates)
 Get Started
Before You Invest More In Growth, Know What Is Limiting It.
Our executive diagnostic reveals where positioning, visibility, recommendation share, and demand systems are suppressing growth.
Who It's ForBuilt For Companies Where Growth Efficiency Matters.
- acquisition costs rise faster than demand
- pipeline growth becomes expensive
- brand strength fails to convert commercially
- pricing power weakens in crowded markets
- growth has plateaued after previous scale phases
- investors expect more efficient growth
 Our Clients
Trusted By Companies Redefining Their Markets.






 Who we work with
Fellows In Good Company.








 Why Us
Why Leadership Teams Call Us.
Growth problems rarely come from one channel. They come from misalignment between positioning, perception, demand systems, economics, and execution.
Most firms optimise parts. We fix the system.
 Take Action
Win demand before the buying journey begins.
Build preference earlier. Lower acquisition friction. Grow with more control.
When AI recommends your category, does your brand appear?
Does AI position your brand as a category leader?
How structured is your brand content for AI interpretation?
Who dominates AI recommendations in your category?
Are customers referencing AI recommendations?
Unilever's AI-driven visibility soars 20% since June 25, boosting global commerce.
Unilever's AI-driven visibility soars 20% since June 25, boosting global commerce.
Unilever's AI-driven visibility soars 20% since June 25, boosting global commerce.
Unilever's AI-driven visibility soars 20% since June 25, boosting global commerce.
Unilever restructures global commerce around AI-driven discovery.
Mars remains absent across category-defining AI answers.
Nestlé accelerates AI transformation across marketing and operations.
OBSERVED MARKET SIGNALS

We observe increasing recommendation volatility across B2B SaaS categories.

Multiple audited consumer brands show inconsistent AI category association across environments.

AI systems increasingly prioritize source authority over paid visibility signals.
Category leadership is becoming more dependent on retrieval consistency than brand spend.

Early demand formation is shifting toward AI-mediated discovery across industries.
In the 1960s, marketers learned to measure Share of Voice. Pioneers such as David Ogilvy and Rosser Reeves helped establish an era where competitive advantage was built through reach, awareness, and media presence.
In the 1980s, researchers and practitioners began connecting it to Share of Market. The work of John Philip Jones and others demonstrated that brands that maintained a greater share of voice than their market share often achieved sustained growth.
In the 2000s, digital marketers learned to measure Share of Search. Consumer intent became visible through search behavior, creating a new signal for future demand and market momentum.
In 2026, companies must measure Agentic Share of Voice (ASOV™). Because increasingly, decisions are shaped not only by people, but by the systems that inform them.
ASOV

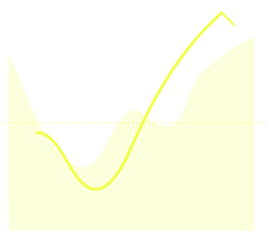
J-Curve
LIVE MARKET INTELLIGENCE
MARKET SIGNAL
What's happening in the market right now.
AUDIT FINDING
How your brand is interpreted by AI systems.
PERCEPTION GAP
Where interpretation is inconsistent or missing.
COMMERCIAL RISK
The impact on demand and preference formation.
DIAGNOSTIC CTA
See how your brand compares.
 MARKETS MONITORED
20
Global industries
 AUDITS COMPLETED
20+
Enterprise brands
 SIGNALS TRACKED
1,250+
AI platforms & sources
AI-MEDIATED MARKET MODEL
The new buying journey

AI systems pre-filter vendors based on relevance, reputation and trust signals.

ASOV™

AI interprets, summarizes and compares your company across multiple data sources.

BPS™

Trust and authority signals are aggregated to form preference and recommendation.

E-POAS™

Buyers evaluate a short-list already shaped by systems and recommendations.

The preferred solution is chosen and the purchase is made.
THE REAL QUESTION
How are AI systems interpreting your brand?
Most companies are invisible in the moments that shape demand. Find out where you stand.